Part D
Dating a Planetary Surface
To decipher the geologic history from a map or cross section, we must determine the age of rock units, geologic structures, and geologic events. Ages can be absolute, where a certain number value represents the age (e.g., the age of the volcanic rock at Tempe Butte is 17.6 million years). Absolute ages are determined by a number of different methods that typically involve measurement of radioactive isotopes present in certain minerals. Ages can also be given in a relative order, where the number age is not determined (e.g., the Kaibab Formation is younger than the Coconino Sandstone). Relative and absolute age dating can be used together to create an ordered history of geologic events that may or may not have precise number dates attached to it.
In dating planetary surfaces, we usually don't have the luxury of seeing rock layers in a vertical sequence in order to determine their proper age order. Neither have we had any way to isotopically date rock samples for an absolute age. By far, the methods used to date the surfaces of other worlds are the cross-cutting relations displayed by rock units, faults, impact craters, etc.
Cross-cutting Relations & Crater Density
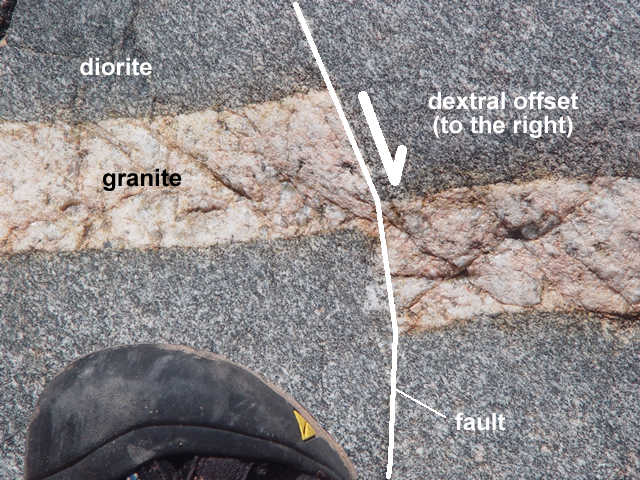
Anything that cuts across or overlies another feature is younger than whatever feature it cuts or overlies. This is a common-sense observation known as the Principle of Cross-cutting Relations. The cross-cutting geologic feature could be a fault that cuts and offsets pre-existing layers, or it could also be an igneous intrusion that cuts across pre-existing layers and bakes them in a zone around the intrusion (see Figure 3-6).
|
|
|
|
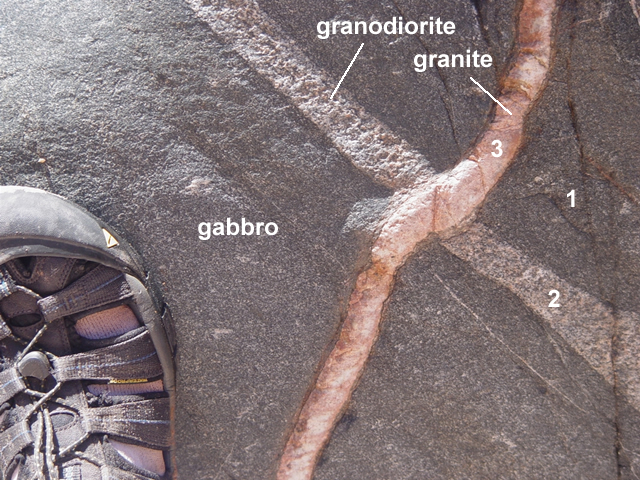
Figure 3-6. Field relations showing the relative dating principle of cross-cutting relations in Tuna Creek, Colorado River mile 99.1, Grand Canyon. On the left, the light-colored granite intrusion is offset by a small fault. The fault that must have occurred after the granite intrusion had cooled enough to respond to the stress by breaking (brittle deformation) instead of folding (ductile deformation). On the right, two light-colored intrusions crosscut the darker gabbro host rock. Click on the pictures to see the annotated images. |
|
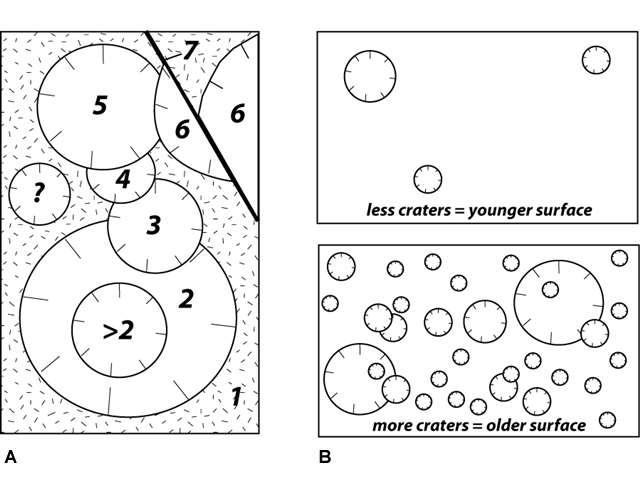
In Figure 3-7a, a lava flow is covered with impact craters. The craters must be younger than the lava flow. Where one crater overlaps or buries another, it must be younger than the other crater. Etc., etc. Additionally, since these meteorite impact craters accumulate over time, the more impact craters a surface has, the older it is (Figure 3-7b). Thus, higher crater density = older surface. Planetary scientists can then estimate the relative age of various surfaces and features by counting the number of craters on them. Furthermore, if we determine the rate at which craters form, then the actual age of a surface can be estimated by counting the total number of craters that have accumulated on that surface.
|
|
|
Figure 3-7. Cross-cutting relations as applied to dating features on planetary surfaces. a) Units, craters, and structures with lower numbers are older than units with higher numbers. The age of the crater marked with a "?" is unknown relative to the other features, and all that can be said about the crater marked with a ">2" is that it is younger than crater 2. b) Surfaces with different crater densities can be dated relative to each other. |
Geologic Sequence Diagrams
A geologic sequence diagram is basically a geologic map or cross section where the relative order of units/events has been determined using the common sense relative dating principles, like the one described above (see Figure 3-8). While the geology shown in these diagrams may not be visible in a single location, the real utility of sequence diagrams is to summarize the geology of an area. These diagrams are typically simplifications of what you would see in nature, but are useful in summarizing the geology of an area.
|
|
|
Figure 3-8. Geology of the Loco Patera quadrangle. |
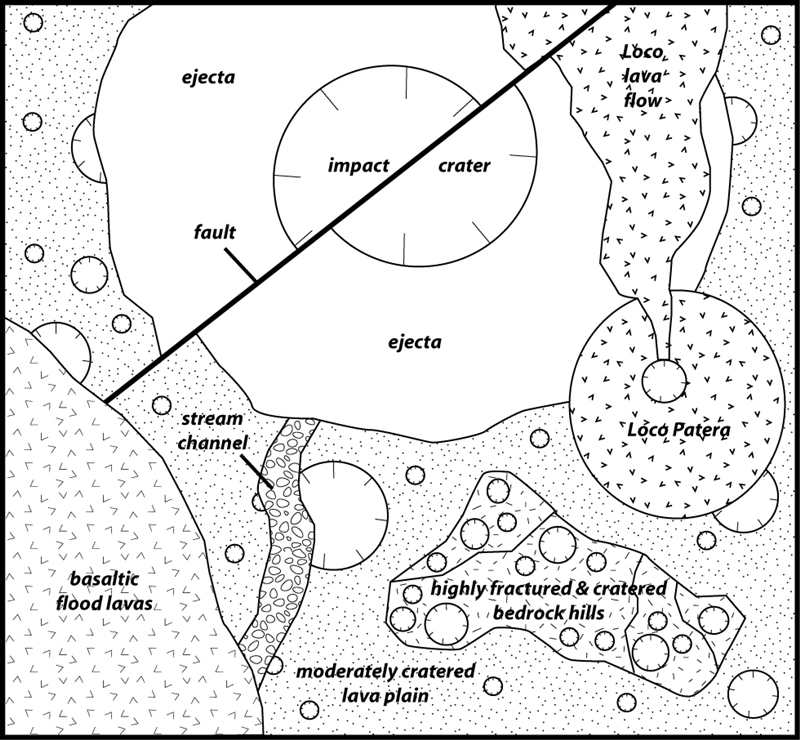
Quiz Me! questions D46 through D50 refer to the sequence map diagram shown in Figure 3-8.
After finishing this lesson, complete the form below: