Part A
Geologic Map Basics
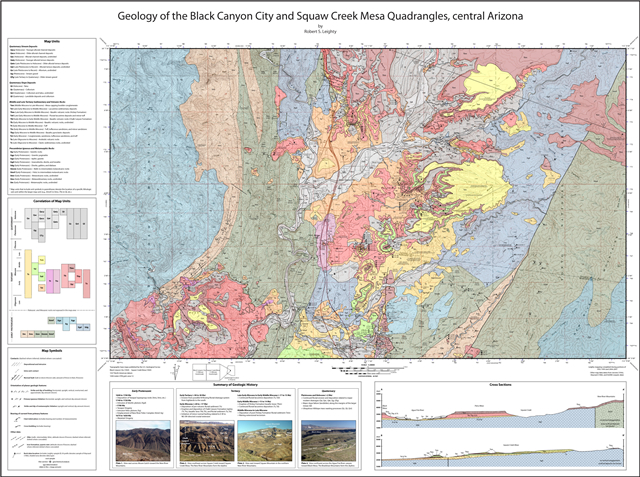
Geologic maps show the distribution of different rock units and structures (like faults and folds) at the surface. These maps are the fundamental medium by which a geologist describes and interprets the geology and geologic history of an area. I like to view geologic maps as unique earth science portraits drawn by a scientist-artist. Traditionally, a geologic map is created by a field geologist who hikes across an area and describes the composition and distribution of various rock types encountered. A geologic map begins to take shape as different map units are drawn and labeled on a topographic base map. Figure 3-2 shows a geologic map for an area north of Phoenix, Arizona. This activity is very time-consuming and may take days, weeks, months, or years, depending on the size of the area, complexity of the geology, the difficulty of the terrain, etc. Data can also be collected remotely, like from an orbiting satellite or automated rover. This is how we have mapped the geology of most of the Moon and several other planetary bodies.
|
|
|
Figure 3-2. A geologic map of an area north of Phoenix, Arizona. |
Map Content
There are many types of geologic maps, and the layout and content can vary widely. These maps may be in color or black & white, small or large in size, very simple or highly detailed, hand-drawn or digital, etc. Most maps will include some or all of the components highlighted in Figure 3-3.
|
|
|
Figure 3-3. Typical content of a geologic map. |
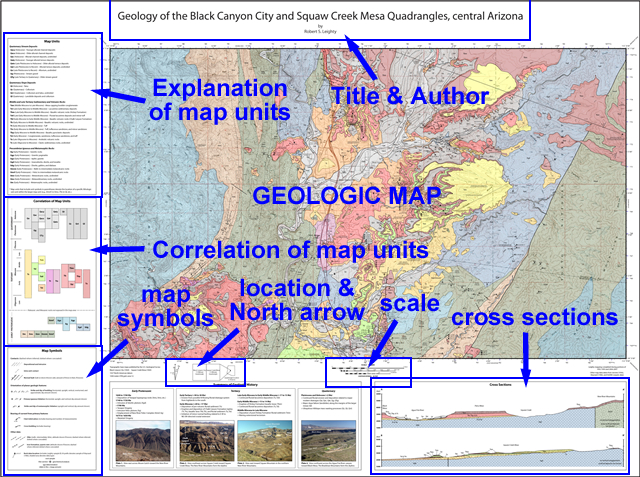
Let's review a few of the more important items:
Title & author(s) - Maps should be titled, with the authors listed.
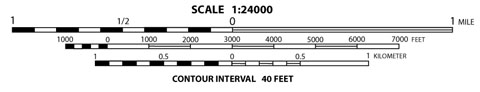
Map Scales - As with topographic maps, graphical and ratio scales are essential for the reader to understand distances and areas represented on the map. Remember from Lab 2, a ratio scale is simply a comparison of map distances with actual "real world" distances, so 1:24,000 means that one centimeter on the map equals 24,000 actual centimeters on Earth's surface. You just need to convert 24,000 cm into a more meaningful value (like 240 meters or 0.24 kilometers).
Topographic base map - Geologic maps are commonly constructed on a topographic base, but not always. If present, the topographic contours are typically printed lighter than the geologic lines. When topo base maps are included in the map, a contour interval may also be listed. Geographic location of the map area may also be included.
North arrow - All maps should include a north arrow to show orientation of geographic north. Some will show the difference between geographic north and magnetic north (a.k.a. the magnetic declination).
Spatial coordinate markings or grids - Many maps will include location information (latitude/longitude, UTM, etc.) allowing determination of precise locations on the map.
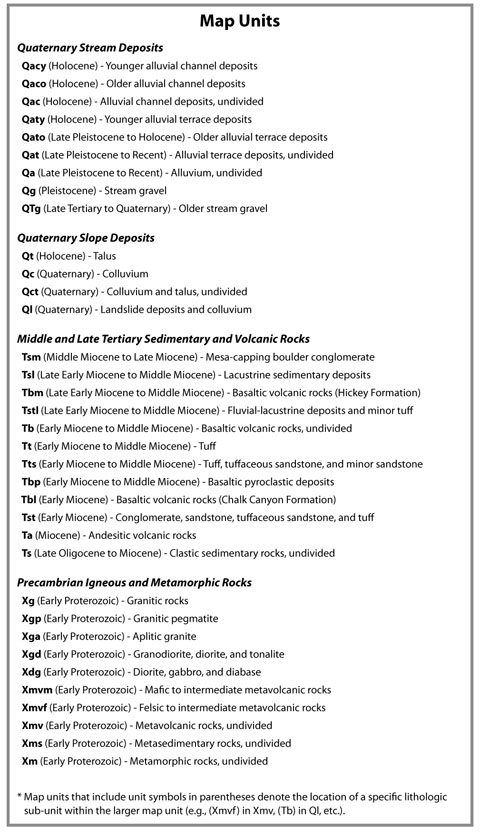
Explanation of map units - All maps will have a description (names, ages, symbols, etc.) of the geologic map units so the reader knows what the different units represent. Map units are listed from oldest (at the bottom) to youngest (at the top). Brief descriptions of the map units and special map symbols are commonly present. If you see a symbol on the map that you do not recognize, then look in the explanation!
Map units - The core data of any geologic map lies in the distribution of map units, each having distinctive physical characteristics. A fundamental map unit is a Formation, which is a rock unit (like the Hickey Formation) that can be distinguished from other units in the field. It must be mappable; meaning that it must cover a large enough area to be shown on a geologic map. A lesser unit is called a Member (like the Flour Sack Member of the Bright Angel Shale), and several members combined can make a formation. Alternatively, several similar formations can be joined together into a larger Group (like the Big Bug Group), and groups can likewise be joined into a Supergroup (like the Yavapai Supergroup). Rock formations are named by geologists typically after the locations (type localities) where the rock unit was first described or is best represented, but can also refer to the composition of the rock unit.
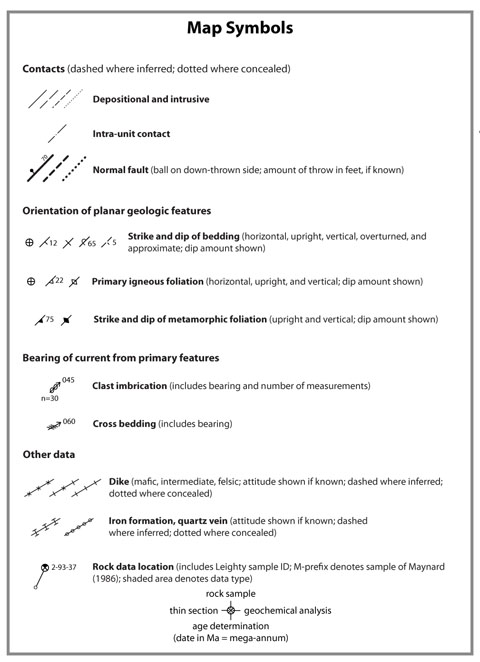
Map unit boundaries are delineated by contacts. Typically, solid line contacts mean that the location of the map unit boundary is relatively sharp or well-located, whereas a dashed contact may imply a gradational or less well-located boundary. Dotted contacts represent the inferred location of unit boundaries that are covered by overlying material. Remember, contacts are not contour lines (which are related to elevation). There are different types of contacts, depending on the nature of the geologic feature present (like rock units, faults, intrusions, etc.). Remember, contacts are not contour lines (which are related to elevation).
Map unit symbols - Map units always have labels or symbols to identify them, but the exact symbols used on different maps can vary widely. However, with most map unit symbols, the first letter is capitalized and typically represents the geologic age (time period) of the formation, whereas the second (lower case) letter is a descriptive tag that represents the formation name, rock composition, etc. For example, the Hickey Formation has the map unit symbol Tbm, where "T" is the age of the formation (Tertiary period, 66-2.58 million years ago), "b" is basalt (the main rock type of the formation), and "m" is middle Miocene (a more specific age description). The symbols are printed on the geologic map, as well as in the map unit explanation.
Correlation of map units - While the Explanation of Map Units is a text list typically written in age order, some maps will include a Correlation of Map Units, which is a very helpful graphic that shows the age relations of the various map units.
Explanation of map symbols - Many other symbols can be used on geologic maps and a key to their explanation is important in understanding the map. Common symbols include different types of map unit and fault contacts, rock orientation symbols (strike and dip), special geologic features (dikes, quartz veins, etc.), sample locations, etc
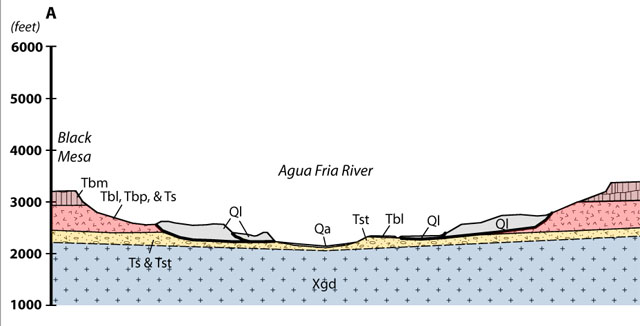
Geologic Cross Sections - Some maps may include one or more geologic cross sections, which are basically topographic profiles between two or more points on the map that include an interpretation of the geology in the subsurface. The geometry of units below the surface is inferred from the orientation of rock units at the surface. Subsurface geology can also be described from canyon wall exposures, well log data, and various geophysical methods (seismic, gravity, etc.). These figures can be highly interpretive, but are very helpful in visualizing distribution of rock units below the surface. The locations of cross section lines or endpoints are marked on the map. Geologic units may be projected above the profile surface to better show the orientation of geologic structures.
Other data - Numerous other kinds of data may be included on a geologic map, including diagrams, data tables, photo imagery, map location, stratigraphic columns, etc.
|
Example 1 |
|
What map unit has the symbol "Ta"? |
|
Andesitic volcanic rocks |
|
Example 2 |
|
What is the map unit symbol for Quaternary talus? |
|
Qt |

|
Example 3 |
|
Are the location of rock data samples included on this map? |
|
Yes - sample locations, ID, and type of data are all included. |
|
Example 4 |
|
What map unit caps Black Mesa in the western part of cross section A-A'? |
|
Tbm |
|
Example 5 |
|
Is the ratio scale listed on the map? |
|
Yes - look above the graphical scale at the bottom center of the map. |
Geology of the Black Canyon City and Squaw Creek Mesa Quadrangles
Now that you've been briefed on the basics of how to read geologic maps, answer Quiz Me! questions A01 through A20 using the Geology of the Black Canyon City and Squaw Creek Mesa Quadrangles, central Arizona map (see the PDF link below).
|
Geology of the Black Canyon City and Squaw Creek Mesa Quadrangles, central Arizona |
Author & Map Scale
Explanation of Map Units
Correlation of Map Units
Geologic Map
Cross Sections