Part A
Reading Topographic Maps
As shown in Figure 2-2, there are many forms of media that we can use to interpret the surface of the Earth, and you will become familiar with several of them in this lab activity. We will start with topographic maps, as they are a fundamental tool to use and understand for anyone that studies geology in the field.
|
Figure 2-2. Different representations of the same landscapes. |
|
|
|
|
|
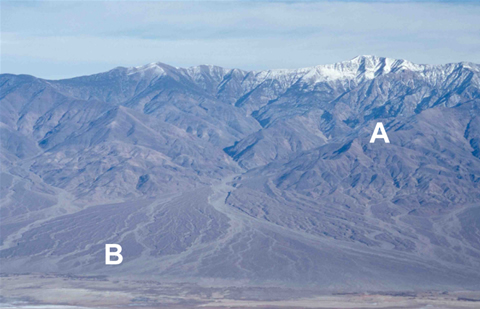
Fig. 2-2a. Surface photo. A picture taken from ground level (Dante's View) across Death Valley. This is the type of data with which we are most accustomed. |
|
|
|
|
|
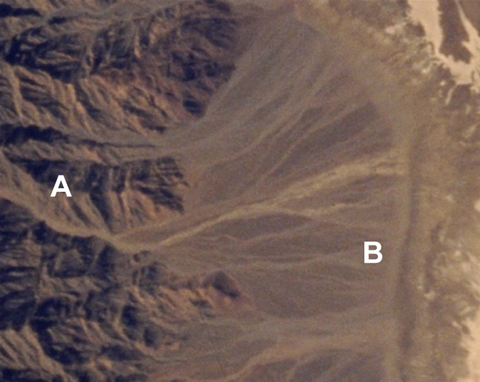
Fig. 2-2b. Satellite photo. A photo taken from orbit above Death Valley. These images can be very helpful in picking out large features on the surface (which may also be more difficult to see from the ground). Aerial and satellite images are also taken using infrared cameras and radars. |
|
|
|
|
|
Fig. 2-2c. Topographic map. A 2D map of the topography shows how elevations change across part of Death Valley. These maps are typically used as the base for geologic maps. You can buy maps like this for minimal cost. |
|
|
|
|
|
Fig. 2-2d. Shaded relief map. A topographic map with subtle shading that helps to accentuate mountains, valleys, plateaus, and canyons. Areas that are flat or have few features are smooth on the map, whereas areas with steep slopes and mountains appear more rough and cast shadows. |
|
|
|
|
|
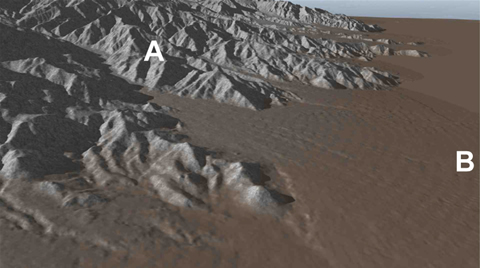
Fig. 2-2e. Digital elevation model (DEM). A 3D model of the topography generated using a computer and a database of elevations. These often make visualizing landscapes fairly easy. |
|
|
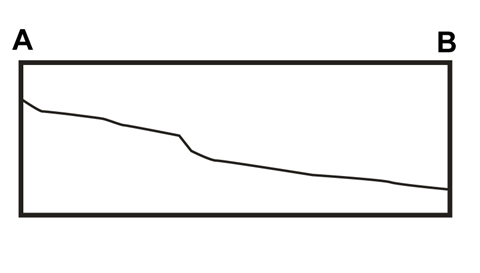
Fig. 2-2f. Topographic profile. These diagrams show the changes in elevation along a line connecting points on the surface. Profiles very plainly show the changes in slope of the ground between points on the surface. |


Topographic Maps
Let's start with topographic maps, as they are a fundamental tool to use and understand for anyone that studies geology in the field. You can use the word "topography" in describing the surface features of a region (like the sea floor or the Earth's land surface), a place (a golf course fairway or a park), an object (a mineral crystal or your skin), or even a field of study (the topography of the U.S. economy). In the geographic sense, a topographic map is a two-dimensional (2-D) graphical representation of the real, three-dimensional (3-D) landscape of the Earth's surface. Figure 2-3 below is the Phantom Ranch 7.5 Minute topographic quadrangle. A topographic map is commonly referred to as a quadrangle because it is usually rectangular in shape. The "7.5 Minute" part of the map name refers to the distance between map corners in terms of minutes of latitude and longitude.
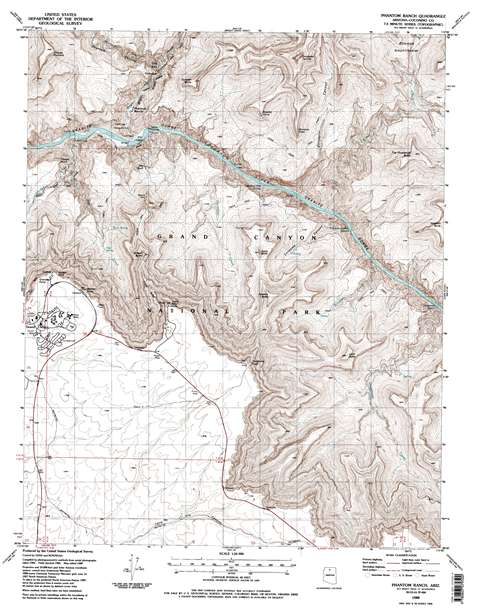
Figure 2-3. The Phantom Ranch 7.5 Minute Quadrangle, a topographic map that covers a portion of the Grand Canyon in Arizona.
A few observations and interpretations are very helpful in guiding our ablity to read landscapes. On a topographic map, different elevations across a landscape surface are represented by various contour lines. In Figure 2-4 below, a contour line is drawn where a horizontal plane (i.e., A, B, or C) intersects the land surface. Where sea level (plane A) intersects the land, it forms the 0-foot contour line. Plane B is an imaginary surface 50 feet above sea level, so its intersection with the land forms the 50-foot contour line. Plane C is an imaginary surface 100 feet above sea level, and its intersection with the land forms the 100-foot contour line. D is the resulting topographic map of the island. It was constructed using a 50-foot contour interval (50-foot vertical increments between contour lines) above mean sea level.
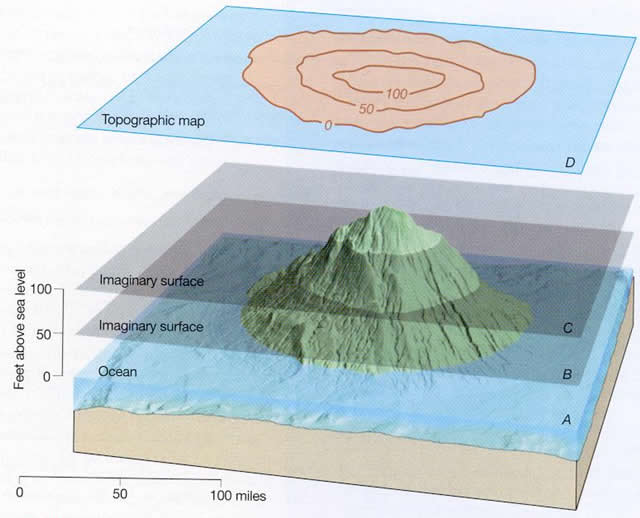
Figure 2-4. Elevation contour lines on a topographic map.
Contour Lines
Let's discuss contour lines some more by using parts of actual topographic maps, like the one in Figure 2-5 below. The following tutorial includes answered sample questions (Examples) as well as questions that you need to answer (Quiz Me!).
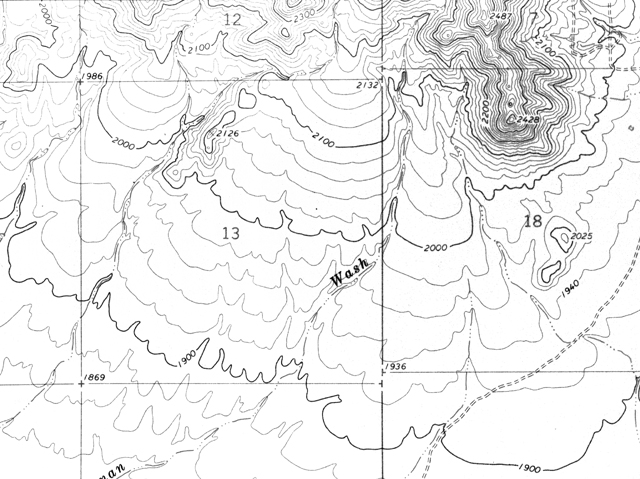
Figure 2-5a. A portion of the New River SE 7.5 minute topographic quadrangle.
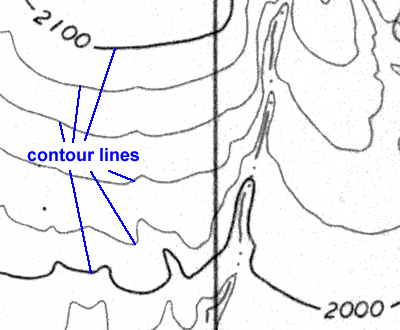
Figure 2-5b. Contour lines shown on a close-up of the New River SE 7.5 minute topographic quadrangle.
Most of the lines on the map in Figure 2-5 are contour lines that represent different elevations in the Daisy Mountain area north of Phoenix, Arizona. Any given contour line represents an elevation measured (in feet or meters) from some reference plane (like mean sea level). Unless otherwise stated, all topographic quadrangles used in this course have elevations measured in feet.
Index Contours
Note that every fifth contour line is printed darker and labeled with an elevation (see Figure 2-6). Simply follow these index contour lines until you find a number that represents its elevation. If a point lies on an index contour, its elevation can be read directly.
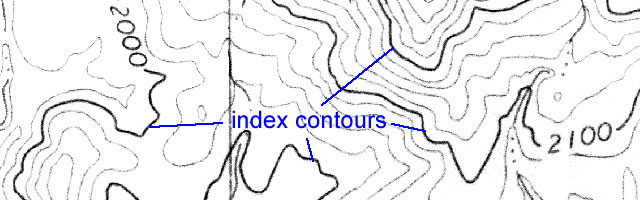
Figure 2-6. Index contour lines shown on a close-up of the New River SE 7.5 minute topographic quadrangle.
|
Example 1 |
|
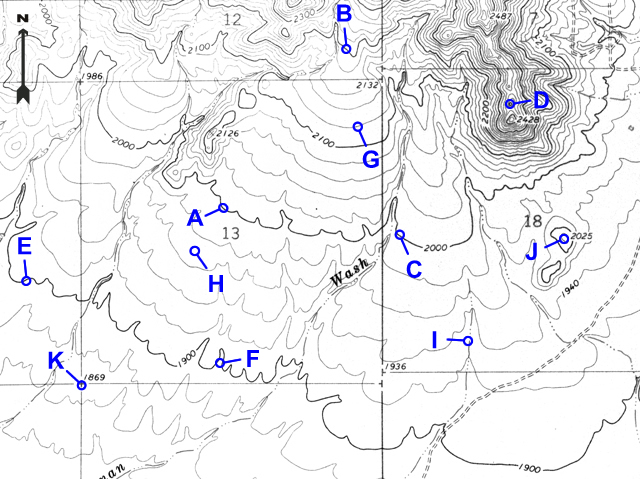
Point A lies on an index contour. What is the elevation of point A? |
|
2000 feet |

|
Example 2 |
|
Point B lies on an index contour. What is the elevation of point B? |
|
2200 feet |
Contour Interval
The difference in elevation between any two adjacent contour lines is called the contour interval (CI) and is commonly written beneath the bar scales at the bottom of a topographic map.
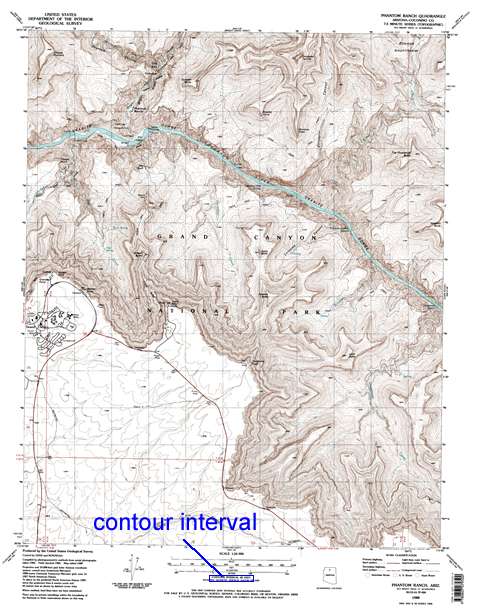
Figure 2-7a. The location of the contour interval on the Phantom Ranch 7.5 minute quadrangle.
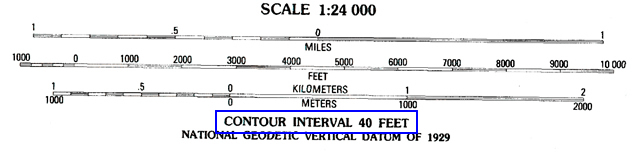
Figure 2-7b. A close-up of the location of the contour interval on the Phantom Ranch 7.5 minute quadrangle.
Some simple (and important) facts about contour interval:
> Values of 10 feet, 20 feet, 40 feet, and 50 feet are common contour intervals. The contour interval for the Phantom Ranch 7.5 Minute quad is 40 feet, which means that the difference in elevation between each contour line is 40 feet.
> Contour lines must be multiples of the contour interval used on the map. For example, if the contour interval is 40 feet, only numbers evenly divisible by 40 (like 40, 80, 120, 160, 200, etc.) can be used as contour lines on the map.
> The size of the contour interval depends on the amount of elevation change across a map. In flat or gently sloping areas, the contour interval is a low number (like 10 or 20 feet), whereas in very steep areas, it is a high number (like 100 feet or more).
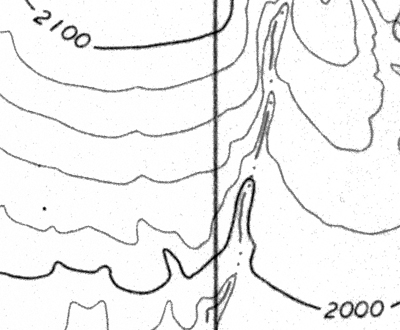
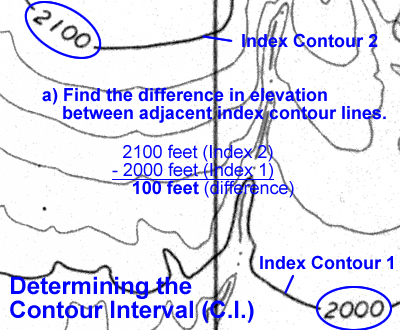
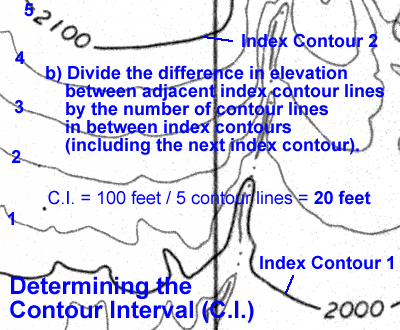
> The contour interval can be easily calculated by finding the elevation difference between adjacent index contours and divide by the number of contours (usually 5) between index contours (including the next index contour). See Figure 2-8 below.
|
Figure 2-8. Determining the contour interval. |
|
|
|
|
|
How do you determine the contour interval on a map? |
|
|
|
|
|
1) Locate two adjacent index contours and find the difference in elevation between them. (2100 - 2000 = 100 feet) |
|
|
|
|
|
2) Divide the difference in elevation between adjacent index contour lines by the number of contour lines in between (including the next index contour). (100 feet / 5 = 20 feet). |
|
|
|
|
|
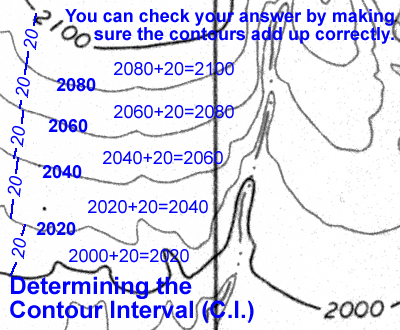
You can do a simple check of your result by labeling (in your mind) each contour to see if they add up correctly. |
|
Example 3 |
|
What is the contour interval of this map? |
|
C.I. = 6900 feet - 6800 feet = 100 feet / 5 = 20 feet |
More About Determining Elevations
Notice that most contour lines are not labeled with any elevation number. The elevation of any contour can be found by counting the number of contour lines (and thus contour intervals) up or down from the nearest index contour line. Be sure to count using the contour interval given for the map.
|
|
|
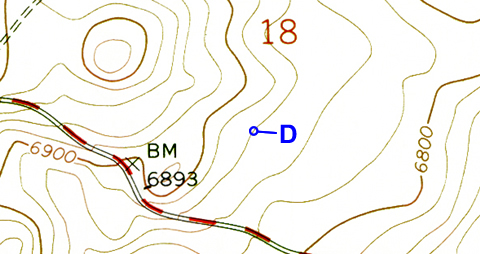
Figure 2-9. A point located on an unlabeled contour line. Point D is located 3 contours above the 6800-foot contour, so its elevation is 6800 + 20 + 20 + 20 = 6860 feet. Alternatively, point D is located 2 contour lines below the 6900-foot contour, so its elevation is 6900 - 20 - 20 = 6860 feet. |
|
Example 4 |
|
What is the elevation of point G? |
|
2100 feet + one 20-foot CI = 2120 feet |

When a point lies between contour lines, its elevation must be estimated by judging distance from the nearest contour lines.
|
|
|
Figure 2-10. A point located between contour lines. Point E is located about halfway between the 6820-foot contour and the 6840-foot contour, so its elevation is 6830 feet. |
|
Example 5 |
|
What is the elevation of point H? |
|
About halfway between the 1980-foot and 1960-foot contours, so 1970 feet |

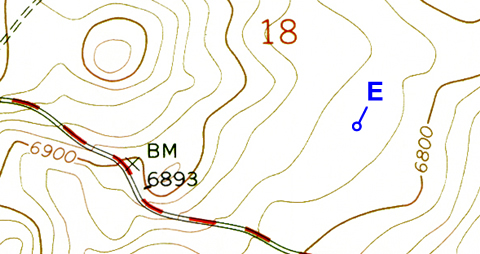
Many points are marked with number elevations. These "spot elevations" have either a number elevation or an "X" and the number elevation. Locations having other symbols or "BM" (benchmarks) are places where elevations have been more precisely surveyed.
|
|
|
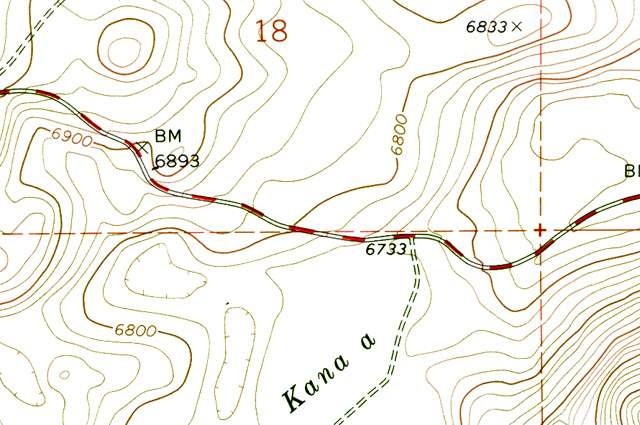
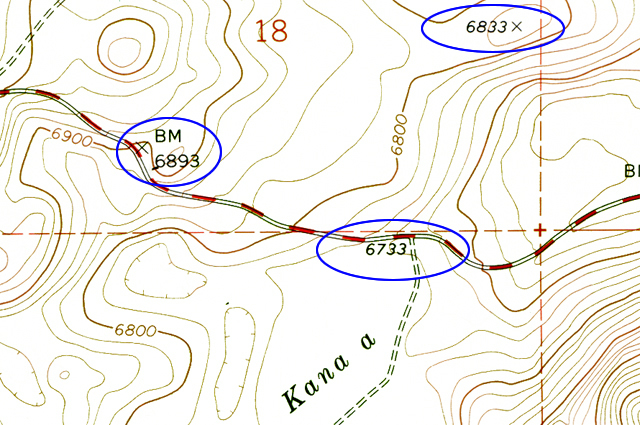
Figure 2-11. Spot elevations and benchmarks. The location marked by "X" and labeled "BM 6893" is a benchmark. The "6833" is a spot elevation for the location marked by the "X" on that hill top. The "6733" is a spot elevation for the road intersection. |
|
Example 6 |
|
What is the elevation of the hill top at point J? |
|
2025 feet |

|
Example 7 |
|
What is the elevation of the section corner at point K? |
|
1869 feet |

Any given contour line (whether it's an index contour or a normal one) connects points of equal elevation. This means that every point on that contour line has the same elevation. A contour line represents only one elevation, so movement across a contour line represents uphill or downhill movement. In this way, contour lines separate areas of lower elevation from areas of higher elevation.
Interpreting Contour Shape and Spacing
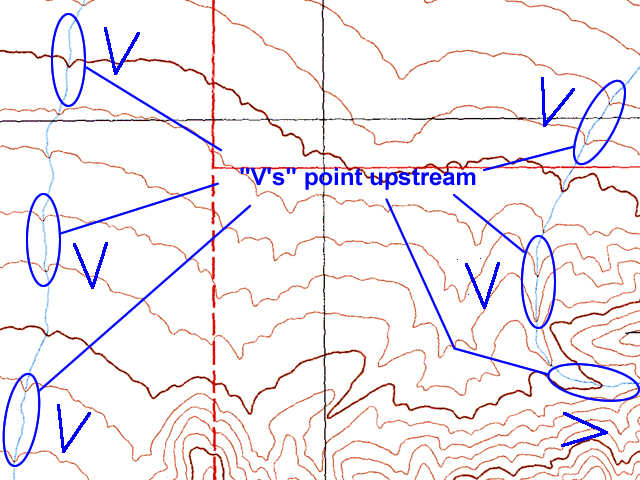
When contour lines cross a stream, the contours bend, or form V-shaped patterns. The "V" always points upstream (or uphill) and can be used to determine the flow direction for the stream.
|
|
|
Figure 2-12. The "Rule of the V's". This is an easy way to determine the direction of stream drainage. |
|
Example 8 |
|
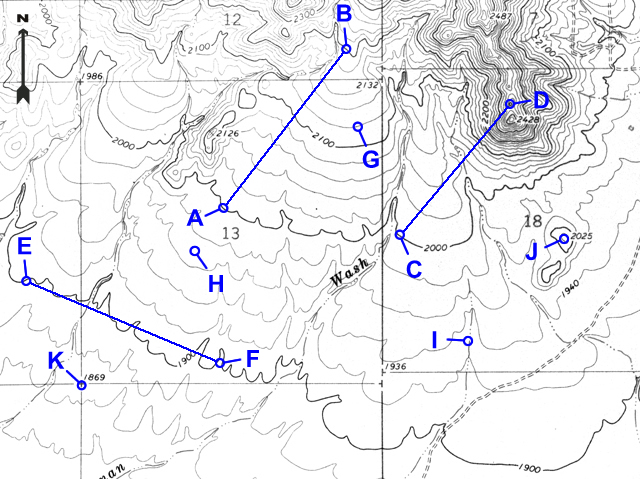
Which way does the stream flow at point I? |
|
South (the vees point upstream/north) |

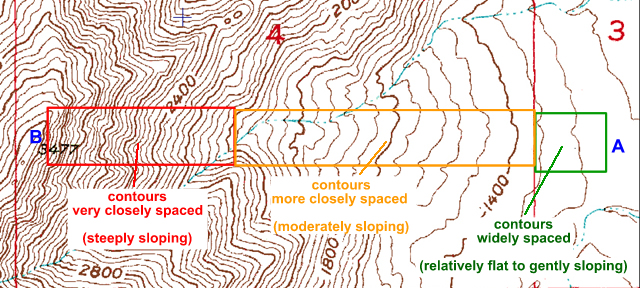
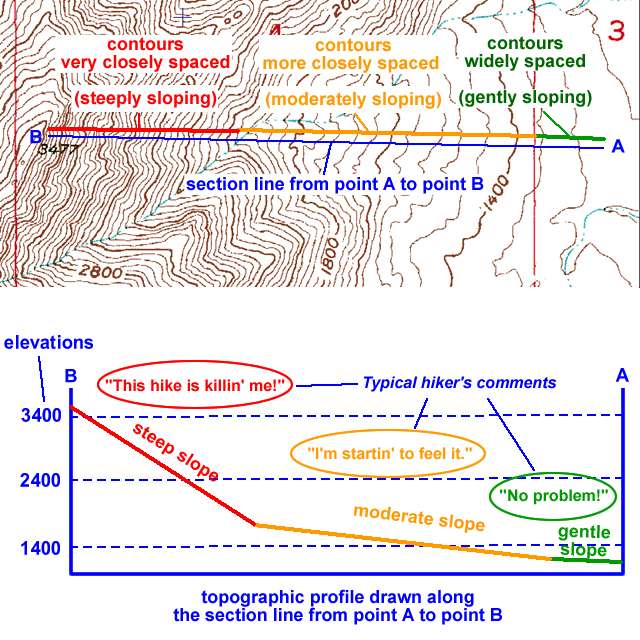
Contour lines make many patterns, but never cross or split. The degree of slope can be inferred from the relative spacing of contour lines: widely spaced contour lines represent a gentler slope, whereas closely spaced contours indicate steep slopes.
|
|
|
Figure 2-13. Contour line spacing. The degree of slope can be determined by the relative spacing of contour lines in an area. |
|
Example 9 |
|
At which point is the slope the steepest: A, C, D, or F? |
|
D |

|
Example 10 |
|
At which point is the slope the most flat: B, G, or E? |
|
E |

Topographic Profiles
A topographic profile shows elevation changes along a certain line (a section line) and shows the slope of the land surface from the side.
|
|
|
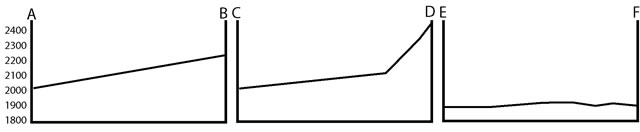
Figure 2-14. Reading a topographic profile. A topographic profile shows the changes in the slope of the ground surface from one point to another. |
|
Example 11 |
|
Which topographic profile shows mostly a gentle slope with a steep slope at one end? |
|
C-D |
|
Example 12 |
|
Which topographic profile line has little or no elevation change? |
|
E-F |
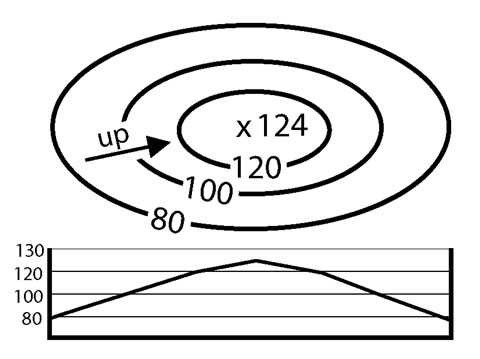
Hills and ridges are represented by closed, commonly concentric contours. The more contour lines on hill or ridge, the higher it is.
|
|
|
Figure 2-15. A simplified map showing contour lines that represent a hill. The corresponding topographic profile for hill is also shown. |
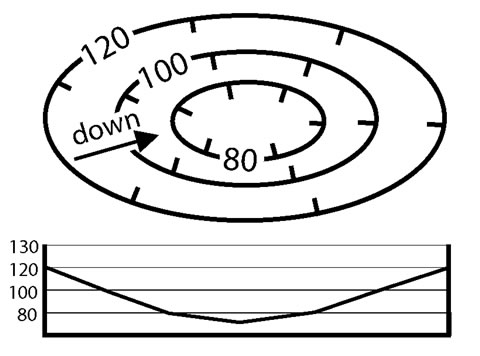
Basins or depressions (low areas having no drainage outlet) in the landscape are shown by closed contours with short lines (hachures) that point downhill. The depth of the depression can be estimated in the same way as we do for hills: by taking the difference in elevation between high and low points.
|
|
|
Figure 2-16. A simplified map showing contour lines that represent a basin. The corresponding topographic profile for basin is also shown. |
Finding Distances on a Map
Since topographic maps and air phoros represent/show the Earth's surface, they can be used to determine distances between points. Knowing the scale of the map provides a way to determine the distance between points on the map. There are three types of scales: graphical, ratio, and vebal, two of which are typically displayed at the bottom center of a topographic map.
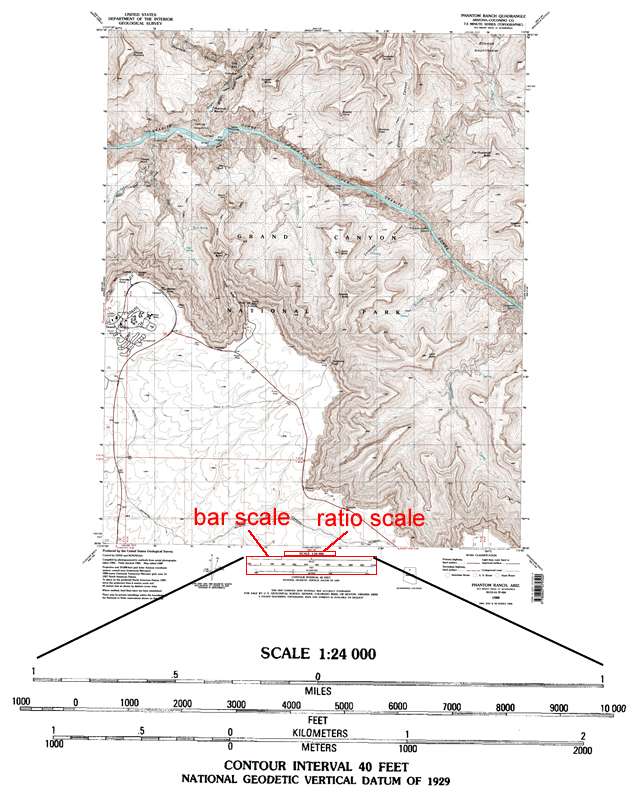
Figure 2-17. The ratio scale and graphical (bar) scales for a 7.5 minute topographic map.
Graphical Scale
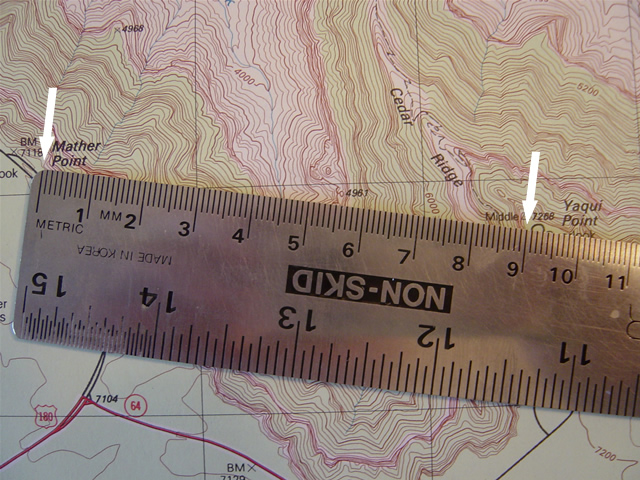
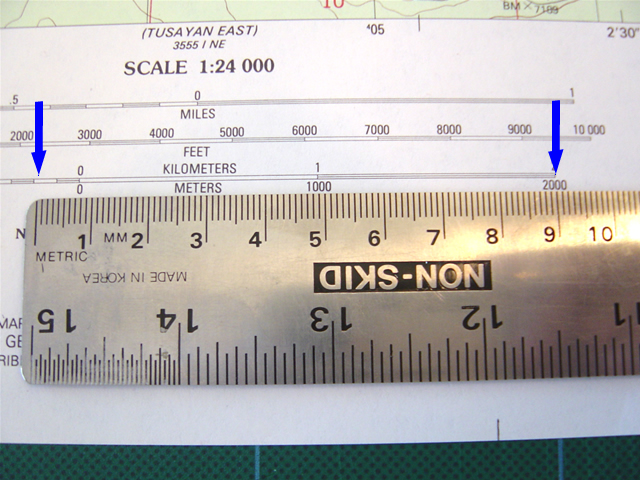
A graphical scale is commonly shown as a bar scale. Most maps have three scale bars: one in miles, one in feet, and one in kilometers. Bar scales are relatively easy to use. The first way to measure a distance is to just measure a distance on the map and then compare it to one of the graphical scales.
|
Example 13 |
|
How far apart (in kilometers) are Mather Point and Yaqui Point? |
|
1) Using any straightedge or ruler, mark the distance between the two points. |
|
2) Place this measurement against the kilometer bar scale and estimate the distance. |
|
It's about 2200 m or 2.2 kilomters |
Ratio Scale
A ratio scale is given numerically as a ratio (e.g., 1:24,000, 1:62,500, 100,000, etc.) and is also typically located at the bottom center of most published topo maps, just above the bar scales. In most cases, it enables a more precise measurement of distance than using graphical scales. A ratio scale is simply a comparison of map distances with actual "real world" distances. For example, 1:24,000 means that one centimeter on the map equals 24,000 actual centimeters on Earth's surface. Two centimeters on the map equal 2*24,000 centimeters or 48,000 centimeters.
|
Example 14 |
|
A map has a ratio scale of 1:62,500. |
|
1 inch on the map = 62,500 on the Earth's surface, |
Verbal Scale
The verbal scale is a comparison of map distances with actual "real world" distances. For example, a ratio scale of 1:24,000 means that one centimeter on the map equals 24,000 actual centimeters on the Earth's surface. Well, that's great, but how far is 24,000 centimeters? We need to convert 24,000 centimeters into a more usable unit.
Hint
When calculating 1 cm = ? m, divide the map scale by 100 (there are 100 cm in 1 m).
When calculating 1 cm = ? km, divide the map scale by 100,000 (there are 100,000 cm in 1 km).
To do this, we divide by 100 (there are 100 cm in one m). Thus, the verbal scale would be "one centimeter on the map = 240 meters on the Earth's surface".
For any given map, you'll only have to do this conversion once. So to calculate "real world" distances, all you have to do is measure the distances between points on the map and multiply by this conversion.
|
Example 15 |
|
On a map, points A and B are 3 centimeters apart. How many kilometers is this? |
|
1) Find the ratio scale of the map. 1:24,000 (so, 1 cm on the map = 24,000 cm on the Earth's surface) |
|
2) Convert the ratio scale 1:24,000 to a verbal scale. 1 cm on the map = 24,000 cm "on the Earth's surface" |
|
3) We want to know the distance in kilometers, so 24,000 cm equals how many kilometers? Since there are 100,000 centimeters in one kilometer, you can convert 24,000 centimeters to kilometers simply by dividing by 100,000 (remember the hint?) 24,000 cm / 100,000 cm/km = 0.24 km Thus, the verbal scale would be "1 centimeter on the map = 0.24 kilometers on the Earth's surface" (again, you'll only have to do this calculation once for any given map). |
|
4) So, if 1 cm on the map = 0.24 km on the Earth's surface, then: 3 cm * 0.24 km/cm = 0.72 km |
|
Example 16 |
|
On a map, points C and D are 3.5 inches apart. How many miles is this? |
|
1) Find the ratio scale of the map. 1:24,000 |
|
2) Convert the ratio scale 1:24,000 to a verbal scale. 1 inch on the map = 24,000 inches "on the Earth's surface" |
|
3) We want to know the distance in miles, so 24,000 inches equals how many miles? There are 12 inches in 1 foot, first divide 24,000 by 12. 24,000 inches / 12 inches/foot = 2,000 feet There are 5,280 feet in one mile, so then divide the 2,000 feet by 5,280 feet. 2,000 feet / 5,280 feet/mile = 0.379 miles Thus, the verbal scale would be "1 inch on the map = 0.379 miles on the Earth's surface" |
|
4) So, if 1 inch on the map = 0.379 miles on the Earth's surface, then: 3.5 inches * 0.379 miles/inch = 1.33 miles |
Finding Places
Using Latitude and Longitude
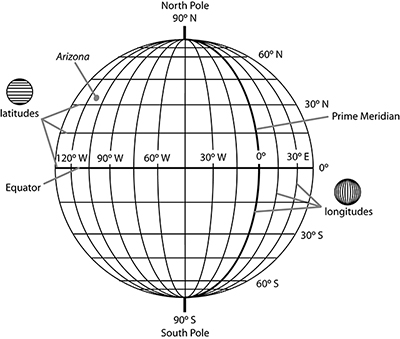
There are several geographical coordinate systems that can be used to locate features on the Earth's surface. One of the most commonly used methods can precisely locate points of interest using a grid system based on lines of latitude and longitude (see Figure 2-18).
LATITUDE - Lines of latitude trend east-west and are parallel to the Equator. Latitude measures distance north or south from the Equator, where the equator is 0° latitude and the poles are 90°. All latitudes north of the Equator are part of the northern hemisphere (0-90° north latitude), and those to the south of the Equator are part of the southern hemisphere (0-90° south latitude). Arizona is located in the northern hemisphere.
LONGITUDE - Lines of longitude trend north-south and measure distance east or west from the Prime meridian (0° longitude). All longitudes east of the Prime Meridian are part of the eastern hemisphere (0-180° east longitude), and those to the west of the Prime Meridian are part of the western hemisphere (0-180° west longitude). Arizona (and the rest of North America) is located in the western hemisphere.
Latitude and longitude coordinates on topographic maps and global positioning system (GPS) devices have different formats, including decimal degrees, degrees and decimal minutes, or degrees, minutes, and seconds (DMS). 1 degree (°) = 60 minutes ('). 1 minute (') = 60 seconds (").
|
|
|
Figure 2-18. The latitude and longitude coordinate system. |
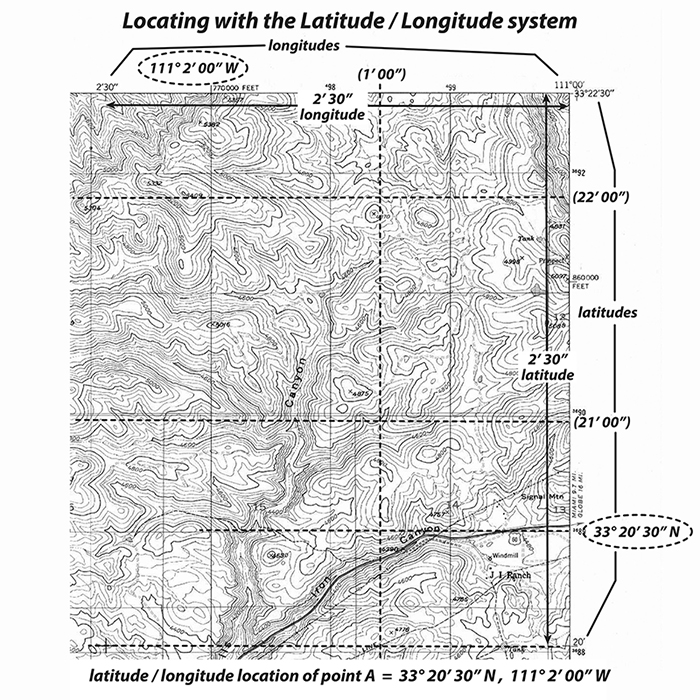
Example 17 describes how to find the latitude and longitude of a known location on a topo map.
|
Example 17 |
|
Determine the latitude and longitude of a known map location: point A. |
|
|
|
1) Latitude - Extend a line (visually or physically with a straightedge) horizontally from the location (point A) to the nearest SIDE of the map. Estimate its latitude between the nearest two coordinates. 33° 20' 30" N |
|
2) Longitude - Extend a vertical line from the location (point A) to the TOP or BOTTOM of the map. Estimate its longitude value between the nearest two coordinates. 111° 2' 0" W |
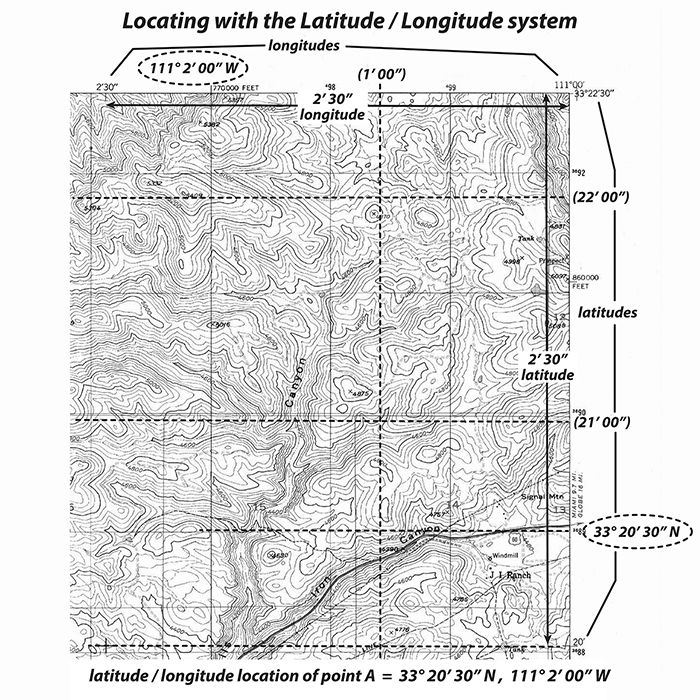
Example 18 describes how to find a location on a topo map using latitude and longitude coordinates.
|
Example 18 |
|
Find a location using latitude and longitude coordinates: 33° 20' 30" N, 111° 2' 0" W. |
|
|
|
1) Find the latitude value 33° 20' 30" N on the left or right side of the map. |
|
2) Extend a line horizontally from the latitude value. The location of interest is somewhere on this line. |
|
3) Find the longitude value 111° 2' 0" W on either the top or bottom of the map. |
|
4) Extend a line vertically from the longitude value. |
|
5) The location of interest is where the latitude and longitude lines intersect. point A |
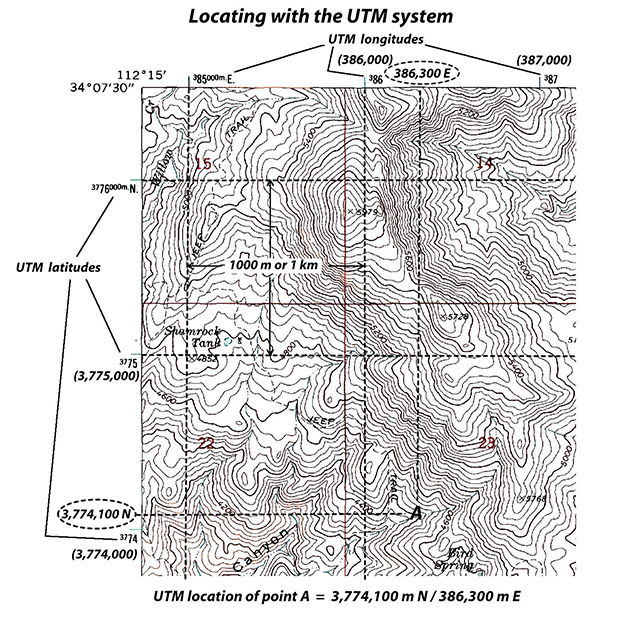
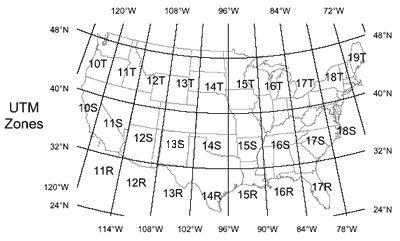
Using Universal Transverse Mercator
The Universal Transverse Mercator (UTM) coordinate system is another grid-based location method that is becoming more commonly used with the proliferation of mobile global position system (GPS) devices. UTM grid coordinates are given in units of distance (meters) that can be easily read on most topo maps. On topographic maps, northing (latitude) UTM values are listed on the side margins and represent the distance in meters from the Equator, whereas the easting (longitude) UTM values are listed along the top and bottom margins and represent the distance in meters from the zone's central meridian (see Figure 2-19).
|
|
|
Figure 2-19. The UTM coordinate system. |
Example 19 describes how to find the UTM northing (latitude) and easting (longitude) values of a known location on a topo map.
|
Example 19 |
|
Determine the UTM northing (latitude) and easting (longitude) values of a known map location: point A. |
|
|
|
1) Northing (latitude) - Extend a line (visually or with a straightedge) horizontally from the location (point A) to the nearest SIDE of the map, and estimate its northing value between the nearest two UTM values. 3,774,100 m N |
|
2) Easting (longitude) - Extend a line vertically from the location (point A) to the TOP or BOTTOM of the map, and estimate its easting value between the nearest two UTM coordinates. 386,300 m E |

Example 20 describes how to find a location on a topo map using UTM northing (latitude) and easting (longitude) coordinates.
|
Example 20 |
|
Find a location using UTM northing (latitude) and easting (longitude) coordinates: 3,774,100 m N / 386,300 m E |
|
|
|
1) Find the northing value 3,774,100 m N on the left or right SIDE of the map. Extend a line horizontally from the northing value. The location of interest is on this line. |
|
2) Find the easting value 386,300 m E on either the TOP or BOTTOM of the map. Extend a line vertically from the easting value The location of interest is where the northing and easting lines intersect. point A |