Welcome!
The video below shows two carts colliding while on a ramp. One cart is held fixed against a bumper at the bottom of the ramp as a second cart is released and allowed to collide with the stationary cart.
Click to show/hide a text description of the video and graph.
Text description of the video:
In the video, two carts have force sensors attached to them and are on an inclined track that slopes uphill to the right. The cart on the left, which is at the bottom of the inclined track, is anchored against a backstop so that it cannot move. A second cart, which is initially farther to the right up the incline, is released so that it collides with the stationary cart at the bottom of the ramp. The force sensors are aligned so that they press against one another during the collision. Each force sensor measures the force that it exerts against the other. The carts collide several times as the moving cart collides with the stationary cart, bounces off, rolls back up the incline, turns around, and rolls back down the incline, colliding with the stationary cart each time it returns to the bottom of the ramp. A graph of the force exerted by each force sensor as a function of time appears in the lower left corner of the video as the video proceeds.
>Text description of the graph:
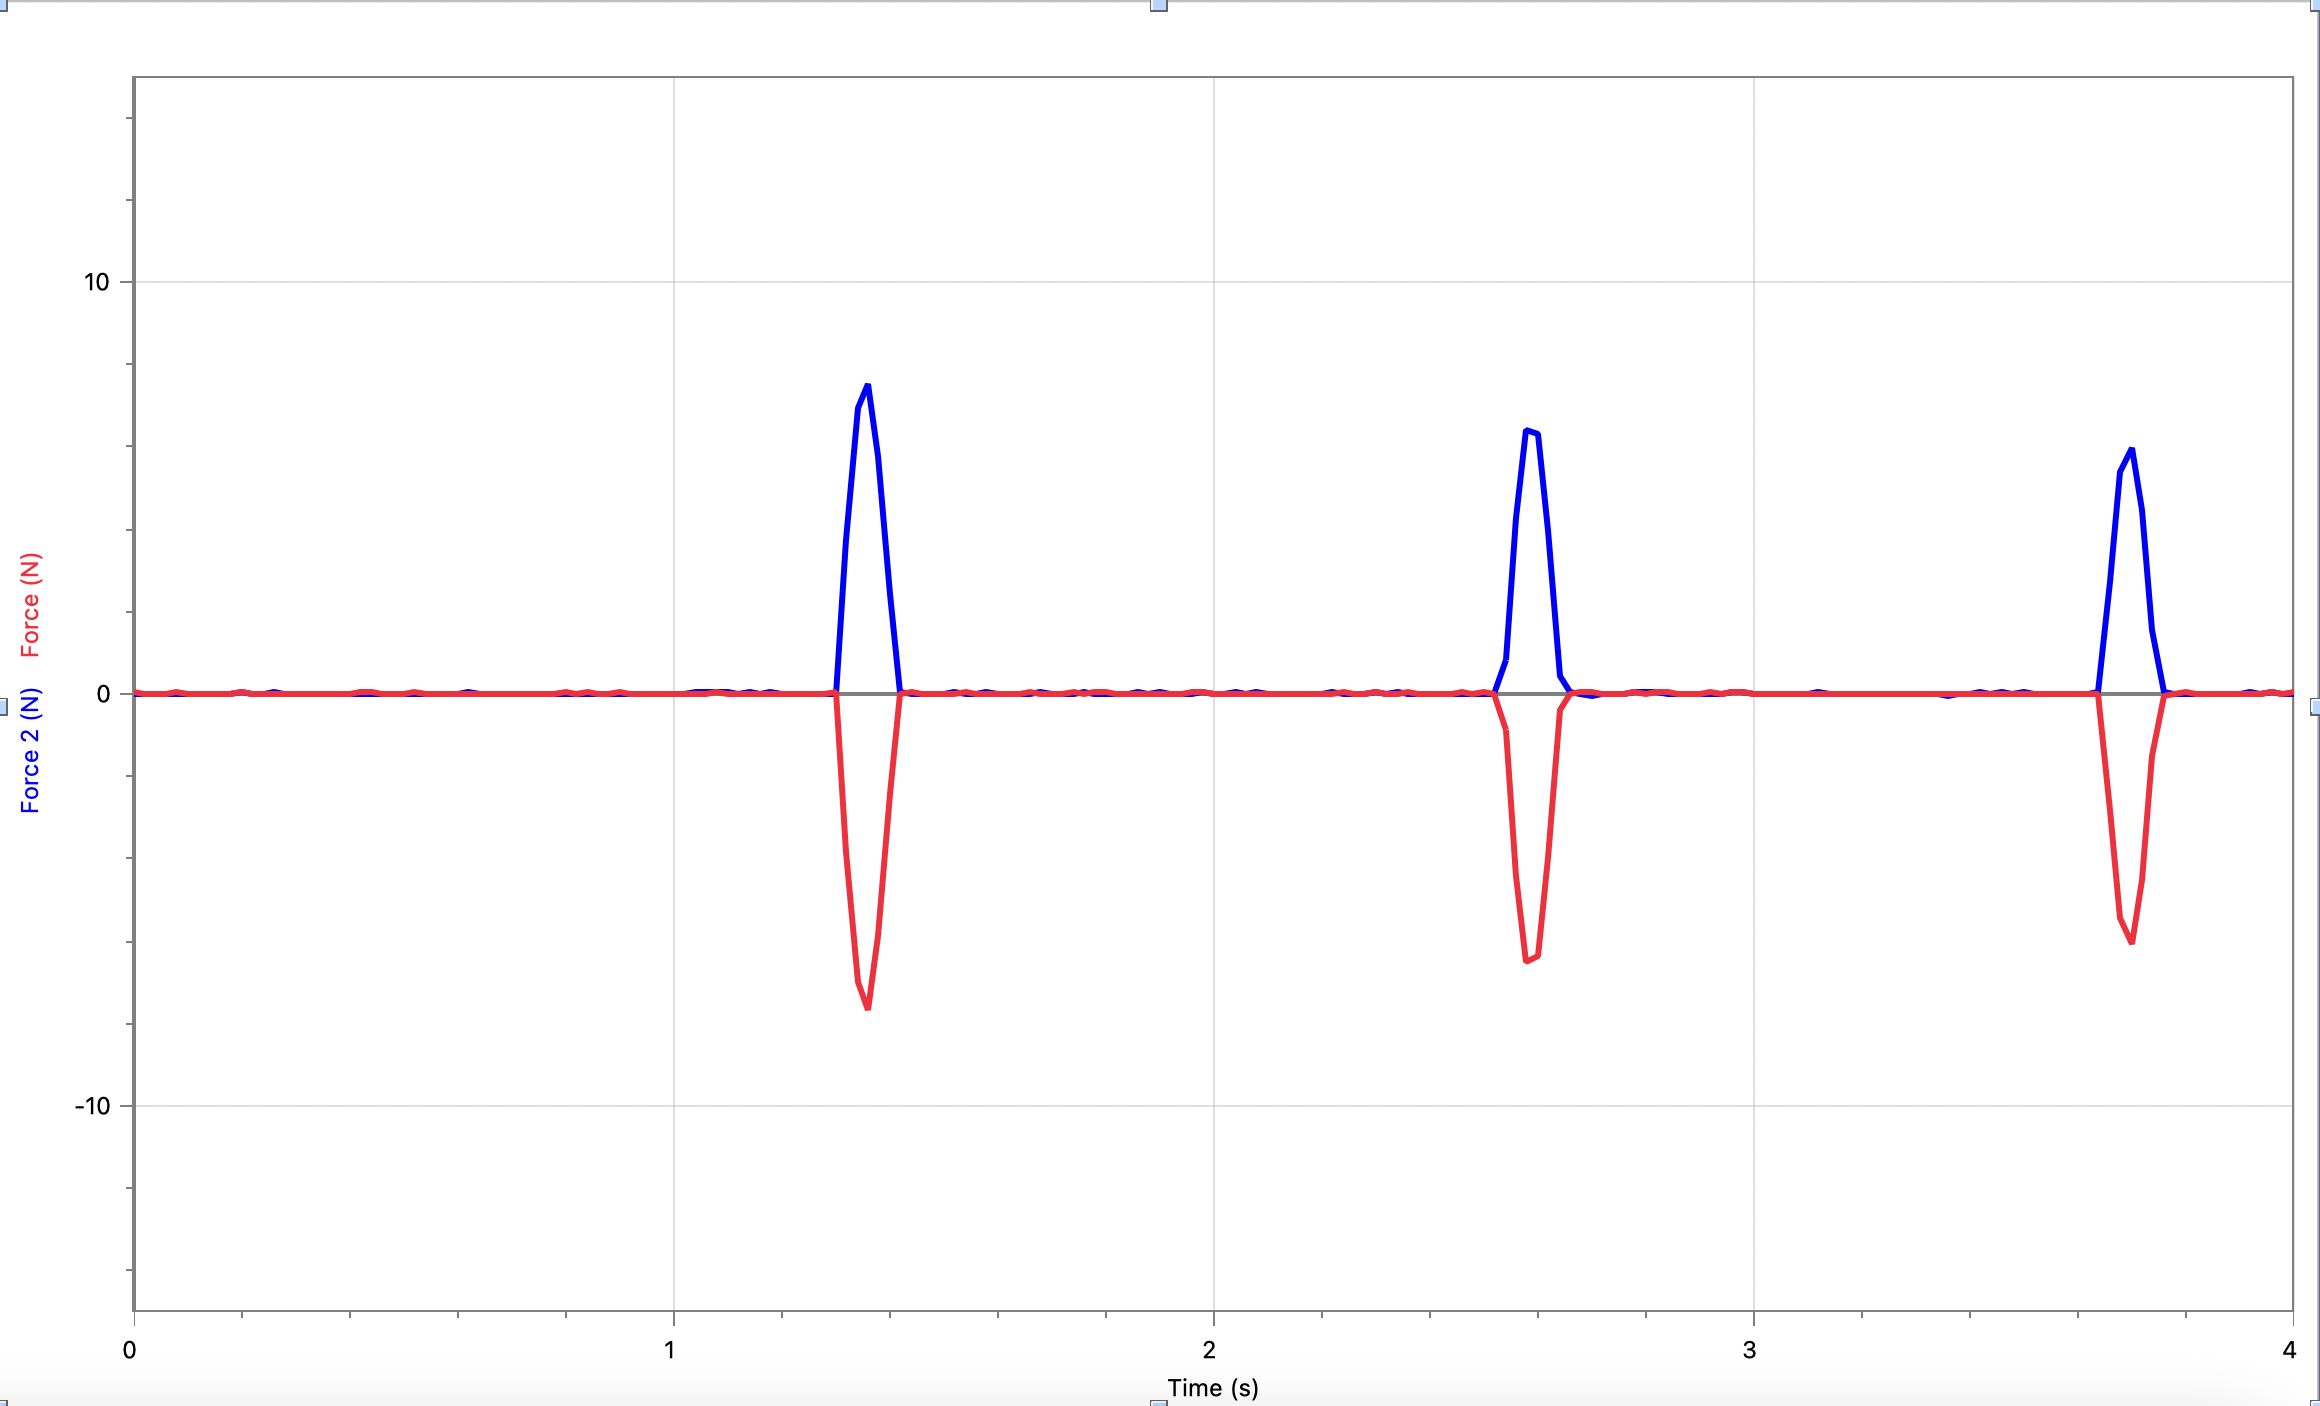
The graph shows two graphs of force vs. time on the same plot, one graph for each force sensor. The data from the force sensor attached to the stationary cart is shown in blue and the data from the force sensor attached to the moving cart is shown in red. The blue trace shows forces above the time axis and the red trace shows forces below the time axis. At each point in time, the blue trace is the same amount above the time axis as the red trace is below the time axis.
The graph from the inset of the video: