How do you determine the direction of
the acceleration from x vs. t and y vs. t graphs?
An x vs t graph describes
the horizontal component of a motion only.�
No information about the vertical component of a motion can be gleaned
from an x vs. t graph.� The opposite is
true for a y vs. t graph.� No information
about the horizontal component of a motion can be gleaned from a y vs. t
graph.�
Both x vs. t and y vs. t
graphs are position vs. time graphs.� The
same rules that describe how to read information from one type of graph apply
to the other type of graph as well.� The
paragraph below refers to an x vs. t graph but could just as easily refer to a
y vs. t graph.
On an x vs t graph, the
slope represents the x-component of the velocity (i.e., vx).� This implies that the sign of the slope
determines the sign of vx and the
steepness of the slope determines the magnitude of vx.� A steep slope corresponds to an object that
is moving fast and a flat slope to an object that is moving slow.�
Consider an object that
is moving along the x-axis.� When it is
speeding up, the x-components of its velocity and acceleration have the same
sign.� When it is slowing down, the signs
of the x-components of its velocity and acceleration are opposite.� When it moves at constant velocity, then the
x-component of its acceleration is zero�
The rules described above
are applied to each of the graphs below to determine the x-component of the
acceleration of each.�
|
|
|
|
|
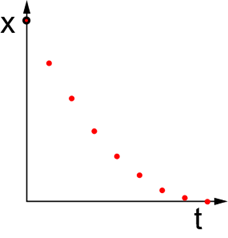
slope < 0 ⇒ vx < 0 steep to flat
slope ⇒
slowing down vx <0 &
slowing down ⇒ ax > 0 |
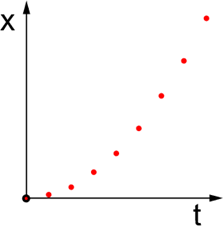
slope > 0 ⇒ vx
> 0 flat to steep
slope ⇒ speeding
up vx > 0 &
speeding up ⇒ ax >
0 |
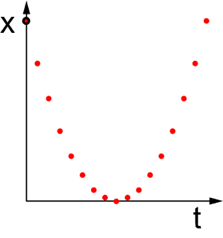
This
graph is a combination of the
first two graphs ⇒ ax > 0 |
|
|
|
|
|
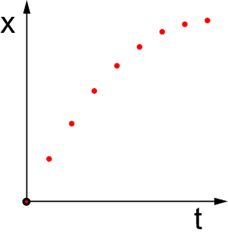
slope > 0 ⇒ vx
> 0 steep to flat
slope ⇒ slowing
down vx >0 &
slowing down ⇒ ax <
0 |
slope < 0 ⇒ vx
< 0 flat to steep
slope ⇒ speeding
up vx < 0 &
speeding up ⇒ ax <
0 |
This
graph is a combination of the
first two graphs ⇒ ax < 0 |
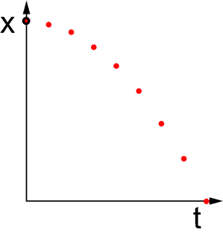
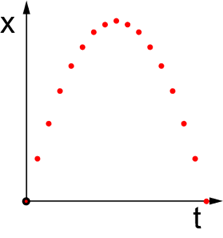
|
|
|
|
|
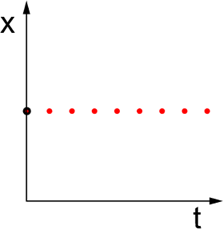
constant slope
⇒ constant
speed constant speed �⇒
ax = 0 |
constant slope
⇒ constant
speed constant speed �⇒
ax = 0 |
constant slope
⇒ constant
speed constant speed �⇒
ax = 0 |
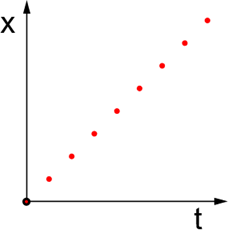
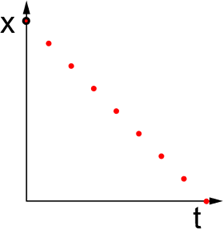
Notice that the three
graphs in the top row all have an ax that is positive.� In addition, notice that the graphs in the
top row have a shape that is part or all of a �smiley face�.� The graphs in the middle row that have
negative ax all have a shape that is part or all of a �frowny
face�.� The graphs in the bottom row that
all have zero ax are all straight graphs.� Hence, the following relationships give a
quick way for determining the sign of ax for x vs. t graphs:
� An
x vs. t graph that is curved like a smiley face has a positive ax.�
� An
x vs. t graph that is curved like a frowny face has a negative ax.�
� An
x vs. t graph that is straight has a zero ax.�
The same relationships
between the shape of y vs. t graphs and the signs of their ay.�
The acceleration selector
is a graph of ay vs. ax.�
The selector only has one choice for the magnitude of the acceleration
in each direction.� Hence, knowing the
signs of ax and ay is sufficient for selecting the
correct acceleration.�