How do you determine the direction of
the acceleration from a vy vs. vx graph?
The definition of the
x-component of the average acceleration is
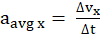 .
.
Since the acceleration in
this simulation is constant, the acceleration (i.e., the instantaneous
acceleration) is equal to the average acceleration.� Since time intervals (i.e., Dt) are always positive, the sign of aavg x is always the same as the sign
of Dvx.� On a vy
vs. vx graph, Dvx �is positive when the final
data point lies to the right of the initial data point since this means that
the final vx is larger than the initial vx.�
Hence:
�
ax is positive when the line of
data points stretches to the right of the initial data point.
�
ax is negative when the line of
data points stretches to the left of the initial data point.�
�
ax is zero if the line of data
points don�t stretch left or right of the initial data
point.
Similarly:
�
ay is positive when the line of
data points stretches above the initial data point.
�
ay is negative when the line of
data points stretches below the initial data point.�
�
ay is zero if the line of data
points don�t stretch above or below the initial data
point.
f
The acceleration selector
is a graph of ay vs. ax.�
The selector only has one choice for the magnitude of the acceleration
in each direction.� Hence, knowing the
signs of ax and ay is sufficient for selecting the
correct acceleration.�