Part D
Fossil Dating
Fossilized animal and plant material is commonly used to determine the relative age of rock units. Single fossils or index fossils can be powerful age-dating tools (see Figure 6-11), but combinations of fossils are more commonly used. A fossil assemblage is a group of fossils collected from the same rock unit (from the same depositional horizon, if possible). The relative age of the sedimentary host rock may be determined once the fossils are identified and their geologic ranges can be plotted. The area of overlap of all the ranges defines the interval of time in which all of the organisms coexisted.
|
|
|
|
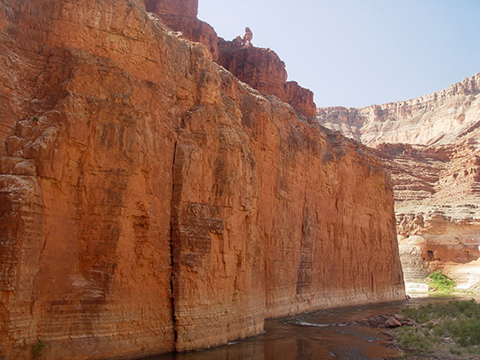
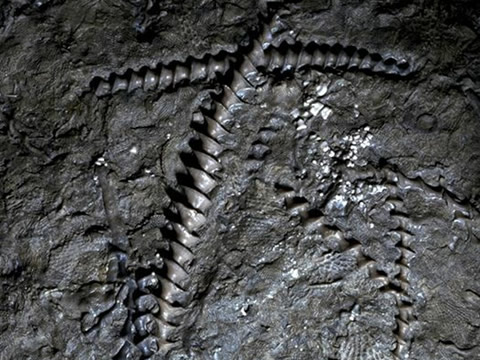
Figure 6-11. Mississippian rocks of the Grand Canyon. The Redwall Limestone is a major cliff-forming carbonate unit in the Grand Canyon (left). The bryozoan Archimedes (right) is an index fossil for rocks of Mississippian age, like the Redwall. |
|
Index Fossils
Some fossils are especially helpful in dating rock. These fossils must satisfy several different conditions to be considered an index fossil:
> abundant (lots and lots of them around)
> short-lived (lived for a relatively brief span of geologic time so have a small geologic age range)
> widespread geographic distribution (not affected by local changes in sedimentary environments (facies changes))
> distinctive in appearance (easily recognizable)
Geologic Age Ranges
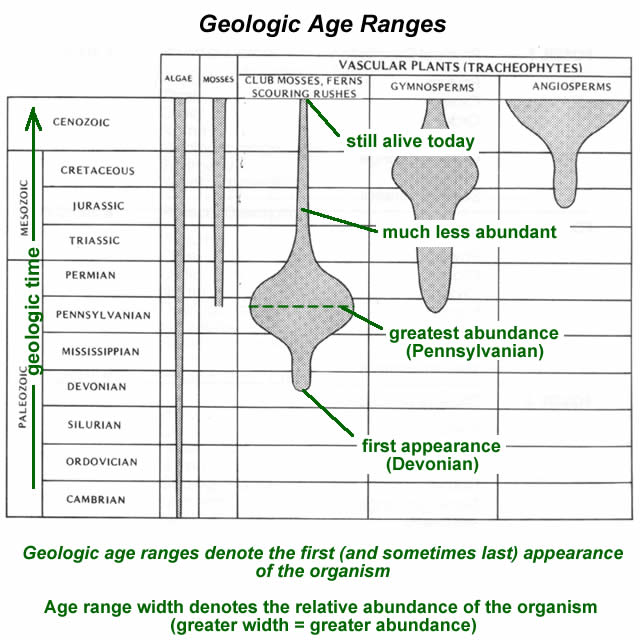
The life span of an organism throughout geologic time is represented by its geologic age range (Figure 6-12). A geologic age range diagram also shows the relative abundance of the organism with time (the wider the geologic range stripe, the greater the abundance of that critter).
|
|
|
Figure 6-12. A simplified geologic age range diagram. |
![]()
![]()
![]()
![]()
![]()
Using Fossil Assemblages to Date a Rock Unit
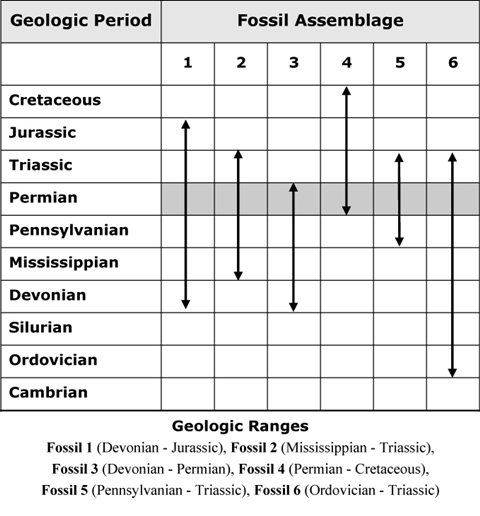
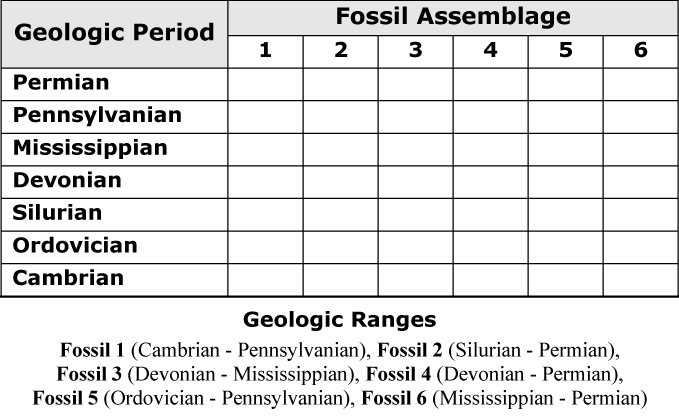
When using fossils to date a rock unit, a group of fossils (a.k.a. a fossil assemblage) must be collected from the same spot in the rock unit (from the same depositional horizon, if possible). The relative age of the sedimentary host rock may be determined once certain information (phylum, genus, etc.) is known about one or more fossils. Once the fossils are identified, their geologic ranges can be plotted (see Figure 6-13). The area of overlap of all the ranges defines the interval of time in which all of the organisms coexisted when the rock was deposited.
|
|
|
Figure 6-13. An example fossil assemblage with geologic age ranges. |
Here is a summary of the fossil assemblage in Figure 6-13:
> Fossil 5 is the best single index fossil because it has the smallest geologic range.
> Fossil 6 is the worst single index fossil because it has the largest geologic range.
> The combination of Fossil 3 and Fossil 4 is the most definitive because their geologic ranges have the smallest amount of overlap.
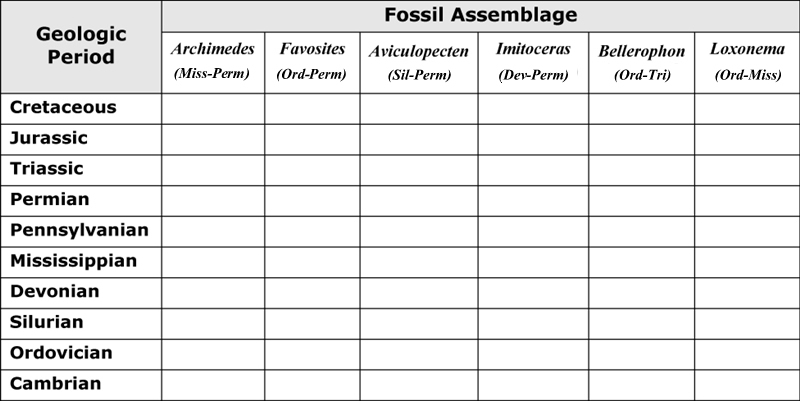
Questions D36 through D39 refer to the geologic age range diagram in Figure 6-14. To answer the following questions, print (or draw) the PDF of Figure 6-14 below (see PDF link) and then draw the geologic age range lines for each fossil using the fossil assemblage geologic range information given.
|
|
|
Figure 6-14. Fossil assemblage and geologic ranges. See the PDF for this diagram HERE. |
![]()
![]()
![]()
![]()
Questions D40 through D43 refer to the geologic age range diagram in Figure 6-15. To answer the following questions, print )or draw) the PDF of Figure 6-15 below (see PDF link) and then draw the geologic age range lines for each fossil using the fossil assemblage geologic range information given.
|
|
|
Figure 6-15. Fossil assemblage and geologic ranges collected from a shallow marine limestone. See the PDF for this diagram HERE. |
![]()
![]()
![]()
![]()
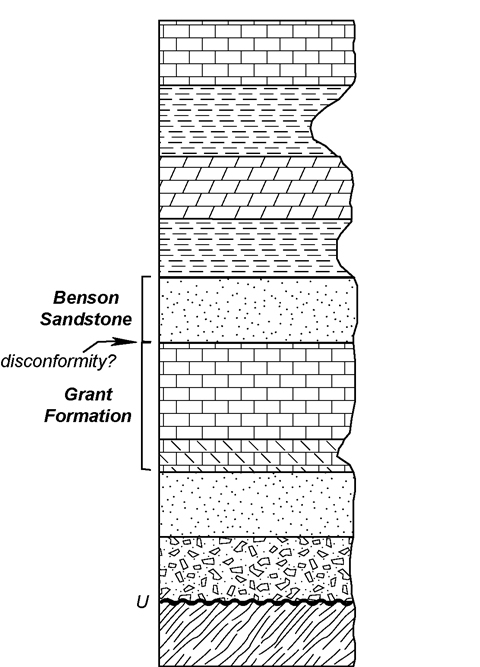
Questions D44 through D50 refer to the stratigraphic column in Figure 6-16 and the geologic age range diagram in Figure 6-17.
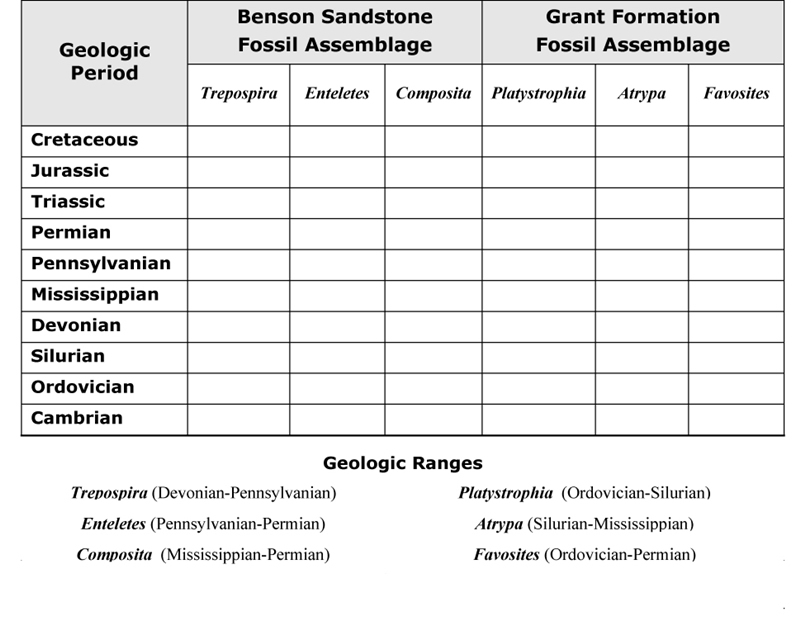
You suspect that there is a disconformity between the Grant Formation and Benson Sandstone, but there is no way to tell without looking at the fossils in the two units. You collect more fossils from each unit (see Figure 6-17) to determine if there is a significant age difference. To answer the following questions, print (or draw) the PDF of Figure 6-17 below (see PDF link) and then draw the geologic age range lines for each fossil using the fossil assemblage geologic range information given.
|
Figure 6-16. Stratigraphic column. If necessary, you can refer to the key to the fill patterns HERE. |
|
|
|
Figure 6-17. Sandstone and limestone fossil assemblages and geologic ranges. See the PDF for this diagram HERE. |
![]()
![]()
![]()
![]()
![]()
![]()
![]()
After finishing this lesson, complete the form below:
